The Problem
This week I had to connect an additional NetApp Storage System to my existing UCS environment through a different path than a similar shared storage platform that we utilize here. This shouldn’t be a big deal but there were a few caveats:
- The Storage System was attached to a dedicated Nexus 5k for this customer
- The VLAN configured on the customer switch collided with one configured in UCS so VLAN translation was necessary through access ports.
- The traffic takes a different switching path from normal NFS traffic in this environment
I configured everything as one normally does when connecting to IP storage, jumbo frames and all. There was only one problem:
~ # vmkping -s 1400 -d 10.0.0.253
PING 10.0.0.253 (10.0.0.253): 1400 data bytes
2508 bytes from 10.0.0.253: icmp_seq=0 ttl=255 time=0.232 ms
2508 bytes from 10.0.0.253: icmp_seq=1 ttl=255 time=0.198 ms
2508 bytes from 10.0.0.253: icmp_seq=2 ttl=255 time=0.265 ms

--- 10.0.0.253 ping statistics ---
3 packets transmitted, 3 packets received, 0% packet loss
round-trip min/avg/max = 0.198/0.232/0.265 ms
~ #
~ # vmkping -s 2500 -d 10.0.0.253
PING 10.0.0.253 (10.0.0.253): 2500 data bytes

--- 10.0.0.253 ping statistics ---
3 packets transmitted, 0 packets received, 100% packet loss
~ #
DOH!
Now, normally this is just a simple issue of the MTU being set incorrectly somewhere along the traffic path but as I dug deeper into this issue that turned out to not be the case, it was something much stranger and more interesting. The IPs, VLANs and hostnames have been changed or obscured to protect the innocent. Onward!
Note: To test pinging with Jumbo Frames in ESXi use the following command:
vmkping -s 2500 -d
Background
I checked to make sure jumbo frames where configured correctly all along the traffic path (ESX, UCS vif and customer switch) but I was still not able to ping the Storage System from the ESXi host using jumbo frames.
For reference the configurations were as follows:
The Network
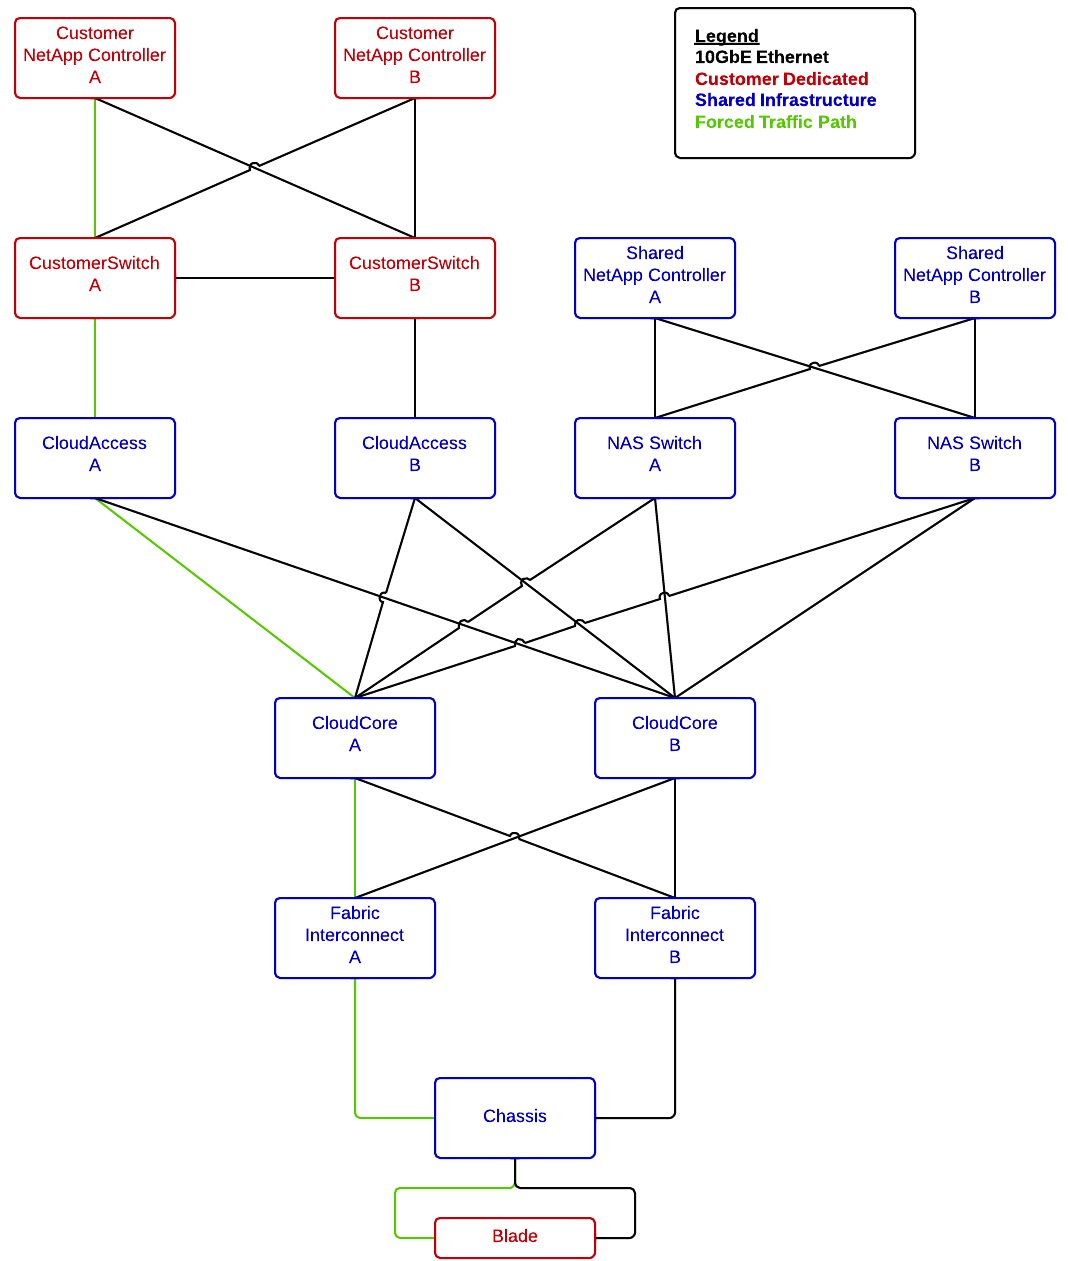
A little about the relevant network topology now, this is a basic diagram of how the network is laid out. There is quite a bit more going on in this network but this diagram shows the relevant parts to this story.
Interface Configurations
interface Ethernet1/30
  description netapp01:E0B
  switchport mode trunk
  switchport trunk allowed vlan 60,177
  spanning-tree port type edge trunk
interface Ethernet1/29
  description cloud_access_a:eth1/17
  switchport access vlan 60
interface Ethernet1/17
  description customer_switch_a:1/29
  switchport access vlan 224
interface port-channel2
  description fi01:po1
  switchport mode trunk
  switchport trunk allowed vlan
  speed 10000
That is it as far as relevant networking goes, onto the VMware side.
~ # esxcfg-vswitch -l
...
Switch Name      Num Ports   Used Ports  Configured Ports  MTU     Uplinks
vSwitch1        5632        6           128               9000    vmnic2,vmnic3

  PortGroup Name        VLAN ID  Used Ports  Uplinks
  ipStorage-vmk             2244     1           vmnic2,vmnic3

~ #
Pretty simple configuration here, standard operating for the most part. When this problem began this host had a standard switch but the configuration was just the same. On to UCS.
UCS Configuration
The interesting thing that we did for troubleshooting was to use a pin group to force the traffic down one set of uplinks through the fabric so we could predict where the traffic was going to go. These snippets don’t reflect the pin group as I removed it after troubleshooting but information on pin groups can be found here.
This is the running configuration of the vETH adapter:
fi01-A(nxos)# sh run interface vethernet 1841

interface Vethernet1841
  description server 1/3, VNIC stgA
  switchport mode trunk
  untagged cos 4
  no pinning server sticky
  pinning server pinning-failure link-down
  no cdp enable
  switchport trunk allowed vlan
  bind interface port-channel1378 channel 1841
  service-policy type queuing input org-root/ep-qos-Storage
  no shutdown
This is the configuration for the CoS class of 4
fi01-A /eth-server/qos # show eth-classified gold

Ethernet Classified Class:
    Priority: Gold
    CoS: 4
    Weight: 9
    BW Percent: 47
    Drop: Drop
    MTU: 9000
    Multicast Optimize: No
    Admin State: Enabled
ucpd01-A /eth-server/qos #
Now, onto the other end, the NetApp.
Storage System Configuration
Not too much to see here, but we can verify that the MTU is actually 9000.
filerA> ifconfig svif1-60
svif1-60: flags=0x2b4c863 mtu 9000
        inet 10.128.160.253 netmask 0xffffff00 broadcast 10.0.0.255
        partner svif2-60 (not in use)
        ether 02:a0:98:1b:6c:18 (Enabled interface groups)
filberB> ifconfig svif2-60
svif2-60: flags=0x2b4c863
        mtu 9000
        inet 10.0.0.254 netmask 0xffffff00 broadcast 10.0.0.255
        partner svif1-60 (not in use)
        ether 02:a0:98:1b:67:98 (Enabled interface groups)
Despite all of that configuration I was still not able to get ping traffic to traverse the network when forcing jumbo frames.
Troubleshooting
The first thing that I did to try to see what was going on was to set up a simple packet capture on another host with jumbo frames enabled on the same switch as the Customer NetApp Storage System.
~ # vmkping 10.0.0.10 -s 2400 -d
PING 10.0.0.10 (10.0.0.10): 2400 data bytes

--- 10.0.0.10 ping statistics ---
3 packets transmitted, 0 packets received, 100% packet loss
~ #

#Source:
21:00:39.790337 IP truncated-ip - 2346 bytes missing! (tos 0x0, ttl 64, id 34311, offset 0, flags [DF], proto ICMP (1), length 2428)
    10.0.0.121 > 10.0.0.10: ICMP echo request, id 7342, seq 0, length 2408
21:00:40.792509 IP truncated-ip - 2346 bytes missing! (tos 0x0, ttl 64, id 34314, offset 0, flags [DF], proto ICMP (1), length 2428)
    10.0.0.121 > 10.0.0.10: ICMP echo request, id 7342, seq 1, length 2408
21:00:41.794613 IP truncated-ip - 2346 bytes missing! (tos 0x0, ttl 64, id 34320, offset 0, flags [DF], proto ICMP (1), length 2428)
    10.0.0.121 > 10.0.0.10: ICMP echo request, id 7342, seq 2, length 2408

#Destination:
21:01:34.825518 IP truncated-ip - 2346 bytes missing! 10.0.0.121 > 10.0.0.10: ICMP echo request, id 7342, seq 0, length 2408
21:01:34.825614 IP truncated-ip - 2346 bytes missing! 10.0.0.10 > 10.0.0.121: ICMP echo reply, id 7342, seq 0, length 2408
21:01:35.827732 IP truncated-ip - 2346 bytes missing! 10.0.0.121 > 10.0.0.10: ICMP echo request, id 7342, seq 1, length 2408
21:01:35.827825 IP truncated-ip - 2346 bytes missing! 10.0.0.10 > 10.0.0.121: ICMP echo reply, id 7342, seq 1, length 2408
21:01:36.829821 IP truncated-ip - 2346 bytes missing! 10.0.0.121 > 10.0.0.10: ICMP echo request, id 7342, seq 2, length 2408
21:01:36.829935 IP truncated-ip - 2346 bytes missing! 10.0.0.10 > 10.0.0.121: ICMP echo reply, id 7342, seq 2, length 2408
Note: The truncated-ip just means that tcpdump is only capturing headers, using ‘-s0′ switch turns this off.
What we see here is that on the source machine (Another ESXi Host) I can see the ICMP Echo Requests leave the machine and on the destination machine I see the ICMP Echo Requests AND ICMP Echo Replies.
WHAT.
Back to the network diagram:
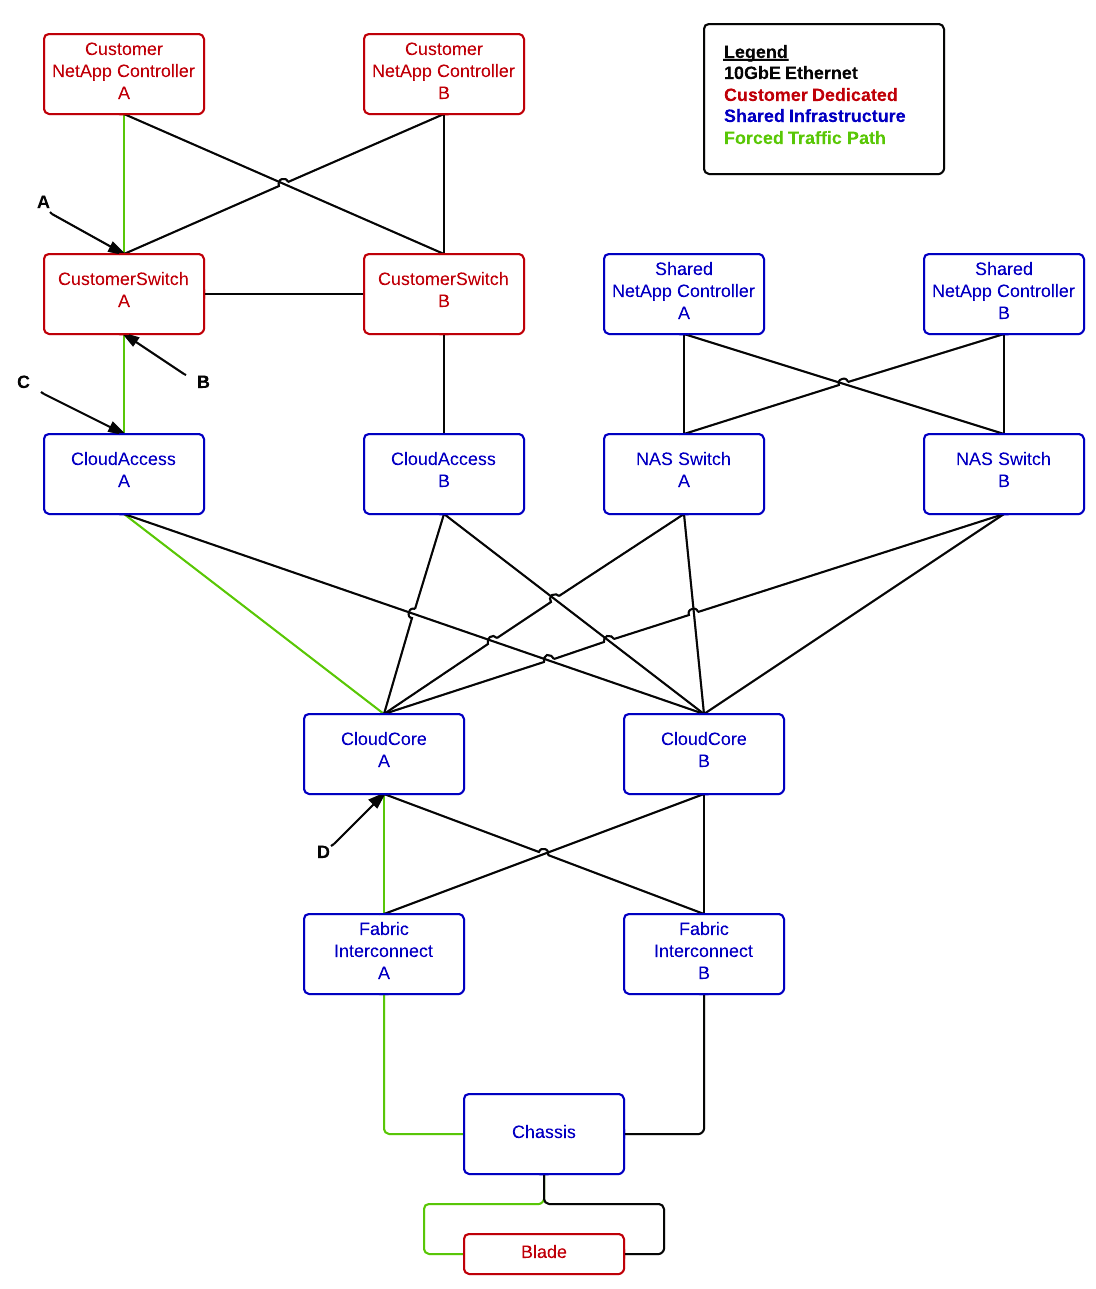
I was doing this capture on a host located at point A, my next step was to check the other end of the path before UCS. I set up a span port at point D to check it out. I wired up a server with an available 10Gbit interface and connected it up.
On the CoreSwitch A the following was set up:
monitor session 1
  description vlan-224-tap
  source vlan 2244
  destination interface Ethernet1/15
  no shutdown
I fired up Wireshark with an ICMP capture filter (no need to crush the disk with 5GB/s of traffic!) and tried the ping again (this time to the filer again). This was the result:
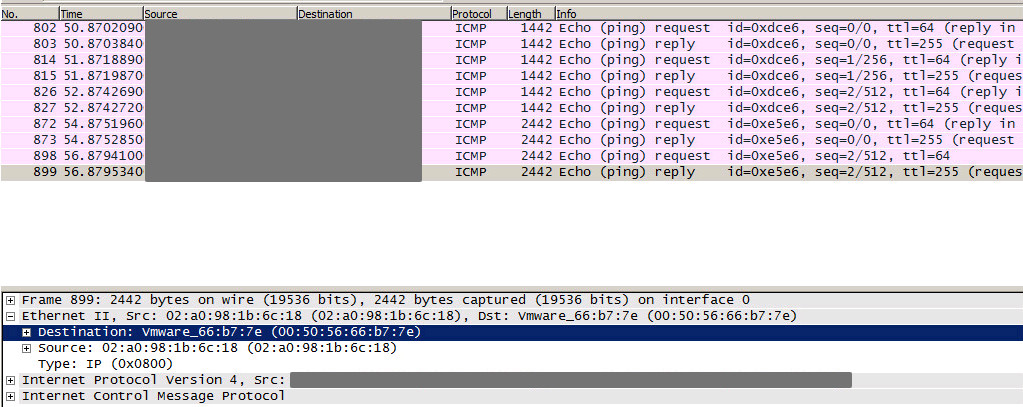
Again:
WHAT.
This was incredibly puzzling. What this meant was that the traffic was correctly making it from the UCS server to the destination and back but was getting lost somewhere inside UCS. I double and triple checked all of the configuration in UCS and ESXi and everything looked right.
One more test, add a known working VLAN to the vIF/vmnic. This is where the shared array on the diagram comes in. I set up a dummy vmkernel port on that VLAN and pinged the shared Storage System and guess what; IT WORKED. So, what did this mean. This means that by any logic we had ruled out both the transit network AND UCS. That was impossible though since it clearly frames were still getting dropped somewhere.
My feeling at that moment can only be described by this meme:

There had to be something strange going on, something we had over-looked. To save anyone else the 20 hours of rage I think it is best if I just skip to the end.
The Solution
This is the part of our story where its time to talk about Ethernet frames and VLAN tags briefly. First, this is an great diagram of an ethernet frame (from this awesome NetApp article):
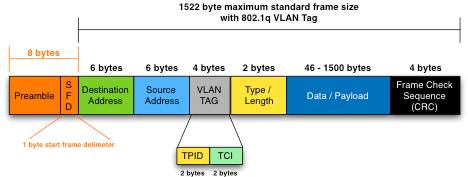
The important part about this frame is the VLAN tag, a 4 byte section added to the frame when using tagged VLANs, which we are in this environment. Diving into that 4 bytes there are two parts, the first 2 bytes are the Tag Protocol Identifier (TPID) which is always set to 0x8100 for 802.1q frames. The second two bytes are the Tag Control Information (TCI). The TCI bytes are divided into two parts, the first three bits are to hold the 802.1p identification information and the remaining bits hold the VLAN ID.
This diagram (that I lifted from here) illustrates this a little bit better:
Now, at this point it probably isn’t apparent why I bring this up, but here it goes. So back on UCS we have the definition of the storage vNIC as such, this time with the important lines marked:
fi01-A(nxos)# sh run interface vethernet 1841

interface Vethernet1841
  description server 1/3, VNIC stgA
  switchport mode trunk
  untagged cos 4
  no pinning server sticky
  pinning server pinning-failure link-down
  no cdp enable
  switchport trunk allowed vlan
  bind interface port-channel1378 channel 1841
  service-policy type queuing input org-root/ep-qos-Storage
  no shutdown
That QoS policy maps to the system QoS policy of Gold, which is defined as follows, again with the important part bolded:
fi01-A /eth-server/qos # show eth-classified gold

Ethernet Classified Class:
    Priority: Gold
    CoS: 4
    Weight: 9
    BW Percent: 47
    Drop: Drop
    MTU: 9000
    Multicast Optimize: No
    Admin State: Enabled
ucpd01-A /eth-server/qos #
So, based on what we have learned about CoS and 802.1q frames, check out the network diagram with some more important information added:
Now, it took us quite some time to realize this and it ended up being an “ah hah!” moment from one of our network engineers but the issue was the fact that we were using an access port to do VLAN translation because CoS information is stored in the 802.1q part of the frame header.
So what was happening was the frames were traveling out and when they hit the first access port © the CoS information was lost when the VLAN tag was stripped. That was all fine until the frame made it back to UcS which dropped the frames on ingress to the Fabric Interconnect because without a CoS tag they were too large (being jumbo frames). This explains why regular frames worked but jumbo frames didn’t, the default CoS class allowed small frames through.
All things considered, the fix is simple, here are the updated access port configurations with the changes marked:
interface Ethernet1/29
  description cloud_access_a:eth1/17
  untagged cos 4
  switchport access vlan 60
interface Ethernet1/17
  description customer_switch_a:1/29
  untagged cos 4
  switchport access vlan 2244
With those changes in place, success!
~ # vmkping -s 2500 -d 10.0.0.253
PING 10.128.160.253 (10.0.0.253): 2500 data bytes
2508 bytes from 10.0.0.253: icmp_seq=0 ttl=255 time=0.232 ms
2508 bytes from 10.0.0.253: icmp_seq=1 ttl=255 time=0.198 ms
2508 bytes from 10.0.0.253: icmp_seq=2 ttl=255 time=0.265 ms

--- 10.0.0.253 ping statistics ---
3 packets transmitted, 3 packets received, 0% packet loss
round-trip min/avg/max = 0.198/0.232/0.265 ms
~ #
This was quite an interesting issue and it caused me to learn quite a bit about how ethernet works in general and as well as how UCS switches.
Another way to solve this is to set the default QoS class to accept jumbo frames but while this would have allowed the traffic to flow it may have caused other performance issues in the future in the event of fabric contention as the traffic would have not been prioritized correctly.
I hope this helps someone else that may run into this in the future!