A few days ago I pushed live a new update for the vOpenData Dashboard which included a few interesting things from an application perspective, I wanted to highlight some of them here.
###The Code
The first major thing is that the first version of the dashboard was written using a framework called Dashing which is a sweet frame work for developing dashboards from any datasource really quickly but, as it turns out, is not great at efficiently handling hundreds of connections.
Because of this I re-wrote the dashboard from scratch using a simple Sinatra app, it ended up only being about 40 lines of actual logic (not including the HTML part) to get the job done, pretty awesome.
This simplicity also allowed me to throw some memcache caching up infront of it to handle just about any traffic I can throw at it. I actually tested up to 250 hits/second using blitz.io and it functioned flawlessly. Awesome.
I also used a totally sweet framework called isotope to do the layout of the tiles on that page that will allow me to do some even cooler things in the future. One thing I did add though was the ability to filter by category, just click on the buttons in the toolbar to drill down a little, you can get views like this for LUNs:
###The Stats
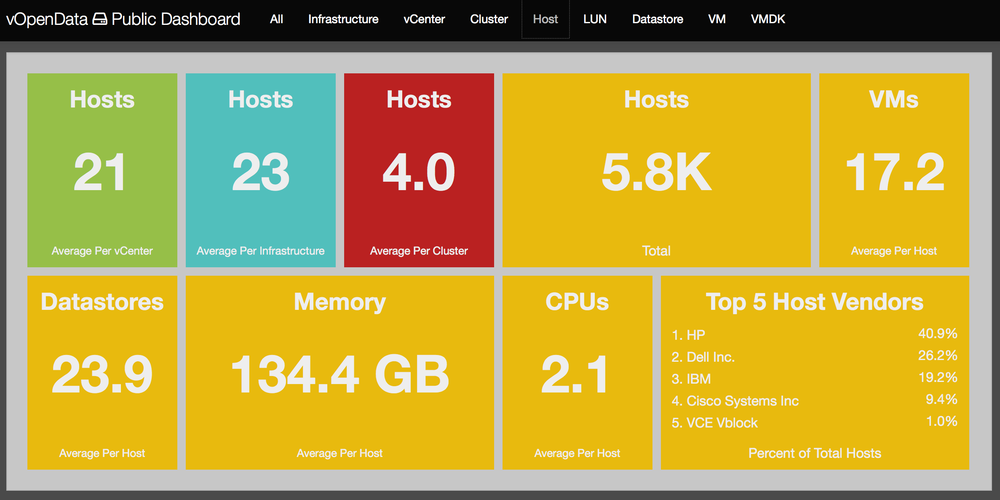
In this version we wanted to bring to the front a few new stats, most importantly being the storage vendor statistics.
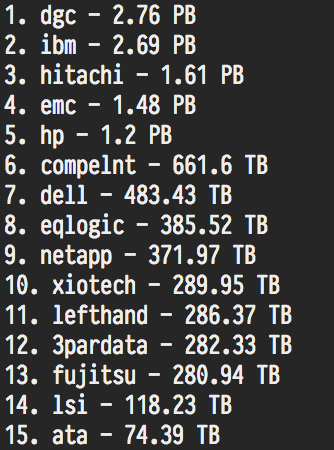
- Storage Stats – These stats may be interesting to some folks as NetApp is not among the top storage vendors on this list. My theory on this is because NetApp admins typically (from my experience) provision large NFS volumes versus smaller VMFS volumes. This stat is based on the number of LUNs not the total storage provided by each vendor (which would also be interesting to see, that will come later) so this list did not really surprise me personally. As a little tease for what is to come, I included a screenshot of the top 15 vendors sorted by amount of storage, interesting results as well.
- Environment Types – Another thing we decided to add was a breakdown of the environment types that we have gotten so far. We thought this would be a great thing to display as it would give everyone an idea of what kind of data we have so far and who we need to bug as a community to upload. I was happy to see that we had a huge portion of the environments being from production server based infrastructures, awesome work.
- Host Hardware – We increased the number of host vendors to 5 (after many asks from all of you!) and this shows basically what I expected as well. I did expect Cisco to have a higher percentage but I suppose those are the larger environments that may not have reported in yet.
- Country Standings – One note about these, I was actually not calculating these correctly (dividing submissions by number of users, doh!) so that is why these seem to have changed drastically. The data is the same, I just am mathing correctly now.
###Data Curation
People were asking if we combine DGC (EMC Clariion based storage) and EMC?
It seems like the census is to spend some time curating the data, combining Dell and Dell Inc for example, so I will be working on some code to do that as part of the next update. This will probably be asynchronous (run as a job on the whole dataset as a whole on a schedule) so it won’t necessarily do it instantly on upload, this is to keep the time it takes to insert the data to a minimum.
###The Future
Next up, the future. I have been doing a lot of thinking about where to take this project in the future. I was really astounded by the response that we have gotten from the community, you all have blown me away. I really have some cool ideas for this project that I am not quite ready to talk about but I think everyone will really love.
My goal is to be able to give everyone the ability to mix this data as they want to see what the community can come up with with all of this data, I am sure some of you have some amazing ideas. If you do have anything in particular send me an email and I would love to chat about it.
I also am looking to give some filtering and mashing up of the data on the private dashboards to narrow the scope of some of the averages, I know that is what people are really looking for.
One more thing (channeling The Steve), the Microsoft sized gorilla in the room. I have thought about the ability to gather stats from other vendors environment in a similar manor to compare and I think this would be really amazing. If any one is (or knows of) a rockstar that can work with the Hyper-V, Citrix, or OpenStack APIs get them in touch with me on twitter or by email.
Until then my head is going to be buried in refactoring and improving the main site codebase to get something really great out to the community, stand by.