It has been quite some time since I have gotten a chance to write on this blog but recently I was able to work with Willian Lam (@lamw) on a really awesome project so I thought this was a great opportunity to start up again. This project really started from a tweet by Duncan Epping (@duncanyb):
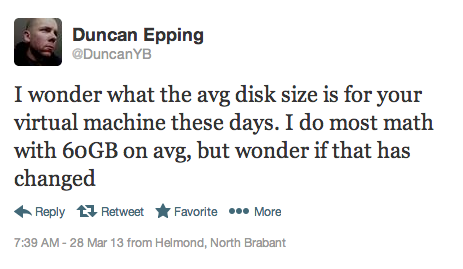
This really got me thinking, I get asked these questions all the time and there really isn’t a good answer to it. Since I am going to need to answer this question more often in the future I decided that I would take on this challenge, thus vOpenData was born.
First a little about vOpenData:
###What is vOpenData?
vOpenData is an open community project that grew from the question “What is the average VMDK size for deployed virtual machines?” We wanted to create an open community database that is purely driven by users submitting their virtual infrastructure configurations. Leveraging the powerful virtualization community and applying simple analytics we are able to provide various trending statistics and data for virtualized environments.
###What information do we collect?
We made an effort to not collect specific information such as hostnames or even display names that could be used to identify a particular organization. Instead, we are using UUIDs which are automatically generated by the virtualization platform to uniquely identify a particular object. This allows us to keep track of changes in the our database when a new data set is uploaded from an existing environment. In addition we are collecting various configuration data and you can find a complete list in the Data FAQs
To see more detail on the project and how to get involved, see the Virtually Ghetto article here: VirtuallyGhetto
I am really excited to see what data everyone is able to provide. The one thing that you will notice is that not all of the statistics are available on the public dashboard; this is to try and get you to get involved by uploading data. There will be a myriad of statistics and reports that we plan on making available to people that upload data into the system.
Now for some gory details, that is why we are here, right? So, to solve this problem in any type of speedy manor I needed to use a tool that was designed for rapid prototyping and development. I recently finished another project using Ruby On Rails so I elected to use that. Going forward I will assume that you have a basic understanding of Ruby On Rails, if not read about it here.
###The Code
With Ruby On Rails I was able to develop the entire application with very little actual code written. In fact there is a built in tool for just this; here are the stats:
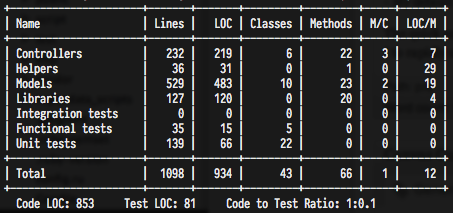
From this you can see that I only had to write about 1000 lines of code for this project, which is really awesome. This doesn’t include the rake tasks that actually calculate the stats, these were another 400 lines or so but are nothing overly complicated.
Another tool that saved me a ton of time was using the Twitter Bootstrap layout framework. (More here) This allowed me to quickly build out a usable and good looking interface in no time, if you have never used it I totally recommend it. Also, there are a few sweet add-ons that allow quick theming of applications; this is a great collection.
Another awesome feature of rails comes from ruby and that is the plug-ability of the gem system. Because of this I was able to use a few select libraries to stand on the shoulders of giants and get this project rolling quickly. My basic stack included the following gems:
Another awesome feature of rails comes from ruby and that is the plug-ability of the gem system. Because of this I was able to use a few select libraries to stand on the shoulders of giants and get this project rolling quickly. My basic stack included the following gems:
I recommend checking all of those projects out, there are some really smart people behind all of them.
###The Platform
The next issue I had to solve was that of hosting all of this data. Due to the fact that I am a lazy sysadmin and have little free time I elected to use a PlatformAsAService (PaaS) for this project so I didn’t have to spend any time building servers, the one I chose was Heroku.
I picked heroku for the following reasons:
- Its fast.
- It’s quickly scalable, I can add worker and background processes on demand with little effort.
- It’s pluggable, I can easily integrate it with many services like RedisToGo (for Resque) and Postgres.
- My default avatar was a Ninja (Ok, not really)
The quick and dirty is that heroku allows you to build a rails app locally and push it (using git) to their production stack with no effort. This allowed William and I to rapidly update the code and discuss changes in near real time. The detailed explanation is lengthy and warrants its own article, more on that later.
Once I chose heroku I needed a place to store all of these uploaded CSV files until I could get them processed (a lengthy process which is done in the background). For this I chose the venerable amazon S3, there was a pretty good plugin (Paperclip) that easily handles the amazon process and allows easy local caching of the files on the workers while they were running. The basic data flow is this:
- You upload data to vOpenData
- The data is copied to S3 for temporary storage
- When your infrastructure’s turn comes up in the queue the data is cached on the worker instance
- The worker inserts the data into the database
Basically for this project S3 is just acting as scratch space until the data can be chunked into heroku.
The last piece of this project was the public dashboard. For that, William came up with an awesome tool by Shopify called Dashing. Dashing is a basic rack app that runs scheduled jobs to fetch data from an API and push them to a live dashboard.
That is basically it, if there are any specific questions leave them in the comments and I will answer them, I am also interested in writing a few follow-up articles if the demand is there to explain some of the code in depth.
William and I submitted a VMworld session to talk about the data that we have collected so far and get feedback from the community, it is “4976 – vOpenData – Crunching Everyone’s Data For Fun And Knowledge” so be sure to vote for it!
One last thing, we plan on adding lots of incremental changes over the next few months to add more features (like more dashboards and data rollups!) so be sure to follow myself (@wazoo), William (@lamw) and the vOpenData (@vopendata) user on twitter to get updates!